Add sensor data to chart (potentiometer, vibration, temperature)

hi guys i tried to add data of a potentiometer between -100 and 100 to the chart of my screen. how can i add im a beginner. please help

"
// This file was generated by SquareLine Studio
// SquareLine Studio version: SquareLine Studio 1.4.0
// LVGL version: 8.3.6
// Project name: SquareLine_Project

#include “ui.h”

void ui_Screen2_screen_init(void)
{
ui_Screen2 = lv_obj_create(NULL);
lv_obj_clear_flag(ui_Screen2, LV_OBJ_FLAG_SCROLLABLE); /// Flags
lv_obj_set_style_bg_color(ui_Screen2, lv_color_hex(0x267AB0), LV_PART_MAIN | LV_STATE_DEFAULT);
lv_obj_set_style_bg_opa(ui_Screen2, 255, LV_PART_MAIN | LV_STATE_DEFAULT);

ui_Label1 = lv_label_create(ui_Screen2);
lv_obj_set_width(ui_Label1, LV_SIZE_CONTENT);   /// 1
lv_obj_set_height(ui_Label1, LV_SIZE_CONTENT);    /// 1
lv_obj_set_x(ui_Label1, -220);
lv_obj_set_y(ui_Label1, -211);
lv_obj_set_align(ui_Label1, LV_ALIGN_CENTER);
lv_label_set_text(ui_Label1, "Broyeur: Donnees Vibrations...");
lv_obj_set_style_text_font(ui_Label1, &lv_font_montserrat_18, LV_PART_MAIN | LV_STATE_DEFAULT);

ui_Button2 = lv_btn_create(ui_Screen2);
lv_obj_set_width(ui_Button2, 160);
lv_obj_set_height(ui_Button2, 50);
lv_obj_set_x(ui_Button2, -296);
lv_obj_set_y(ui_Button2, 204);
lv_obj_set_align(ui_Button2, LV_ALIGN_CENTER);
lv_obj_add_flag(ui_Button2, LV_OBJ_FLAG_SCROLL_ON_FOCUS);     /// Flags
lv_obj_clear_flag(ui_Button2, LV_OBJ_FLAG_SCROLLABLE);      /// Flags

ui_Chart1 = lv_chart_create(ui_Screen2);
lv_obj_set_width(ui_Chart1, 729);
lv_obj_set_height(ui_Chart1, 313);
lv_obj_set_x(ui_Chart1, -2);
lv_obj_set_y(ui_Chart1, -11);
lv_obj_set_align(ui_Chart1, LV_ALIGN_CENTER);
lv_chart_set_type(ui_Chart1, LV_CHART_TYPE_LINE);
lv_chart_set_range(ui_Chart1, LV_CHART_AXIS_PRIMARY_Y, -100, 100);
lv_chart_set_axis_tick(ui_Chart1, LV_CHART_AXIS_PRIMARY_X, 10, 5, 5, 2, true, 50);
lv_chart_set_axis_tick(ui_Chart1, LV_CHART_AXIS_PRIMARY_Y, 10, 5, 5, 2, true, 50);
lv_chart_set_axis_tick(ui_Chart1, LV_CHART_AXIS_SECONDARY_Y, 10, 5, 5, 2, true, 25);


ui_Label2 = lv_label_create(ui_Screen2);
lv_obj_set_width(ui_Label2, LV_SIZE_CONTENT);   /// 1
lv_obj_set_height(ui_Label2, LV_SIZE_CONTENT);    /// 1
lv_obj_set_x(ui_Label2, -300);
lv_obj_set_y(ui_Label2, 204);
lv_obj_set_align(ui_Label2, LV_ALIGN_CENTER);
lv_label_set_text(ui_Label2, "Retourner a l'accueil ");

ui_Label4 = lv_label_create(ui_Screen2);
lv_obj_set_width(ui_Label4, LV_SIZE_CONTENT);   /// 1
lv_obj_set_height(ui_Label4, LV_SIZE_CONTENT);    /// 1
lv_obj_set_x(ui_Label4, 534);
lv_obj_set_y(ui_Label4, 119);
lv_obj_set_align(ui_Label4, LV_ALIGN_CENTER);

lv_obj_add_event_cb(ui_Button2, ui_event_Button2, LV_EVENT_ALL, NULL);

}

What do you want to achieve?

What have you tried so far?

Screenshot or video

Others

  • SquareLine Studio version:
  • Operating system:
  • Target hardware:

Replied in the other topic: How to use Chart widget, ie for temperature data - #10 by the_forgeron

Here is a video that explain the project.

the final goal is to have a vibration sensor put on motor. the chart will show the vibration of motor when i selected wich one.
i just want to have the data from vibration sensor, to be on screen when i click, instead of a static chart.

here is my full project. im using an elecrow hmi esp32 7" inch display. you can try it with a 5" display make sure to make some modification(explanation in the code)

And what is question?

1 Like

just wanna know how do you manage to replace the static data with a variable data that come from an mpu6050?or potentiometer but its the same thing.

Place chart up code here

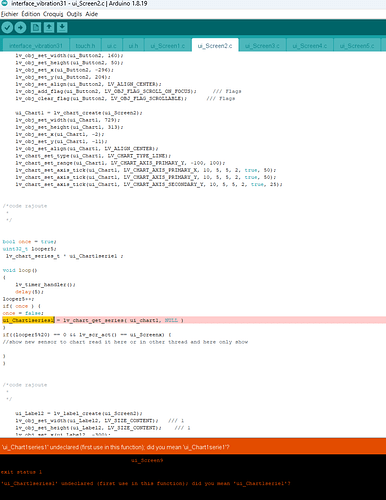
bool once = true;
uint32_t looper5;
 lv_chart_series_t * ui_Chart1serie1 ;

void loop()
{
    lv_timer_handler();
    delay(5);
looper5++;
if( once ) {
once = false;
ui_Chart1serie1 = lv_chart_get_series( ui_chart1, NULL );
}
if((looper5%20) == 0 && lv_scr_act() == ui_Screenx) {
//show new sensor to chart read it here or in other thread and here only show

}
}

How to use Chart widget, ie for temperature data - How to - Forum - SquareLine Studio

https://docs.lvgl.io/master/API/widgets/chart/lv_chart.html

put i t where in the main code or in the screen where the chart is ??

Looks like Marian is giving an example of how you would dynamically update a chart with your sensor data. This would probably be put into a thread (if you wanted constant updating), or could be put into your main code so it only updates when you are on the given screen with your chart (I think the code Marian has would account for that). You’d probably want this somewhere with your system/main code, not in the exported code

Ahhh sorry , but your image show level of your noooob… Arduino have one loop and when you dont know where go back to LEGOLAND

The code example shouldn’t go at all into the ui folder, but outside of it into the main ui/ui.ino file which contains the loop function by default. Your custom updater code can go beside lv_timer_handler as the example shows so it is called periodically as well.

1 Like

so this is an update for those who struggling in the beginning like me. there still work to make the update perfect but i make a big step. for now the chart will update a random series.
this is the main.ino code (the general code)
main code.txt (8.5 KB)
this is the ui_screen3 code where the chart is display
ui_screen3.txt (2.8 KB)

Some part of the code is commented in french so dont be surprise !!!
here a video of the result :

and Marian_M you should come to LEGOLAND too for explaining like a sh**
(updating chart dynamically, variable chart lvgl, lv_chart) (psss this song is a banger: blame brett - the beaches)