What do you want to achieve?
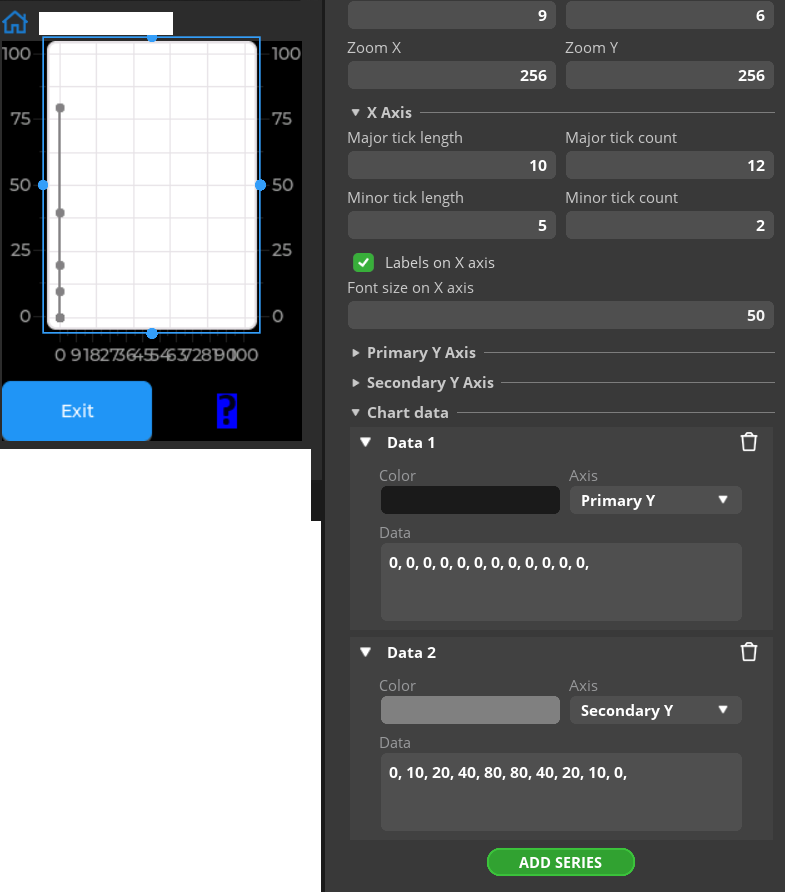
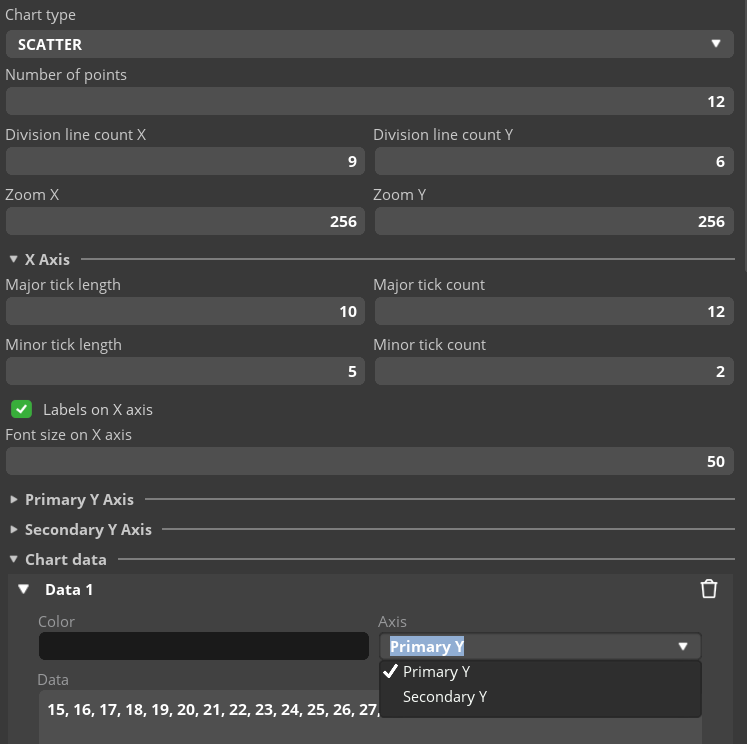
We would like to mock up a scatter chart, confirm the design appearance, then I can hook up the firmware to supply the live data on-devices. But when we tried, we could only add multiple Y-axes, so the plots were always aligned with X=0. Or, were we looking in the wrong place in SLS?
Do you see alternative options and workaround to achieve it? Mention some use cases
I think I can do this manually in LVGL, but it would be useful for my designer to be able to set everything up in SquareLine to his liking first.