What do you want to achieve?
We’d like to offset the X-axis of a plot. Or, specify the min and max of the labels and ticks.
Do you see alternative options and workaround to achieve it?
As a workaround, we were able to add some labels manually, but it’s difficult to keep them registered to the chart properly when rotating the screen, and it’s overall a very manual process. I tried to use a scatter plot, but it didn’t help, and I’ll create another request for that.
Mention some use cases
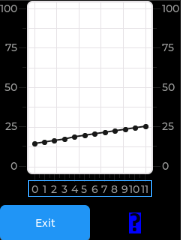
Here’s an example image. These values represent X-axis values between 5 and 16, but the chart widget always displays values 0-11.