100% CPU Load using SLS

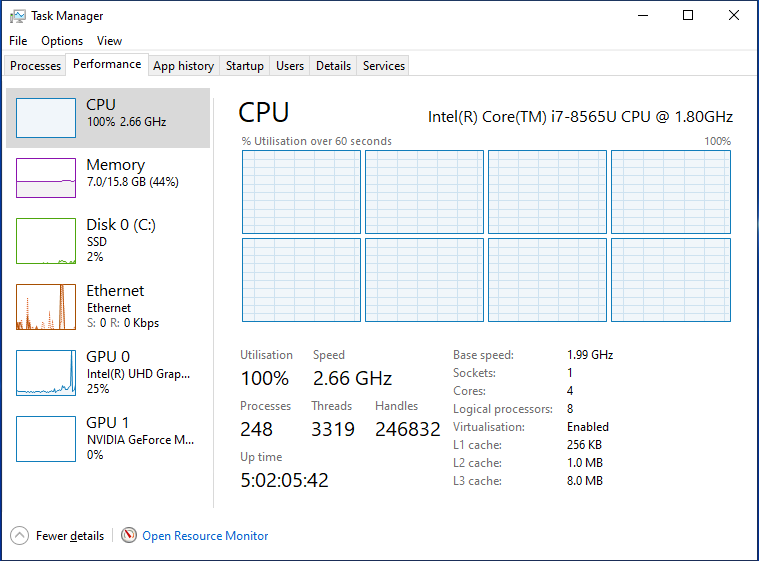
When using the latest trial version of SLS (1.1.1) even with no project loaded,
my CPU load goes from <10% to max at 100%

What do you want to achieve?

Before running SLS CPU load = <10%
Lower CPU usage please!
The high load makes my laptop very hot and the fans very noisy!

What have you tried so far?

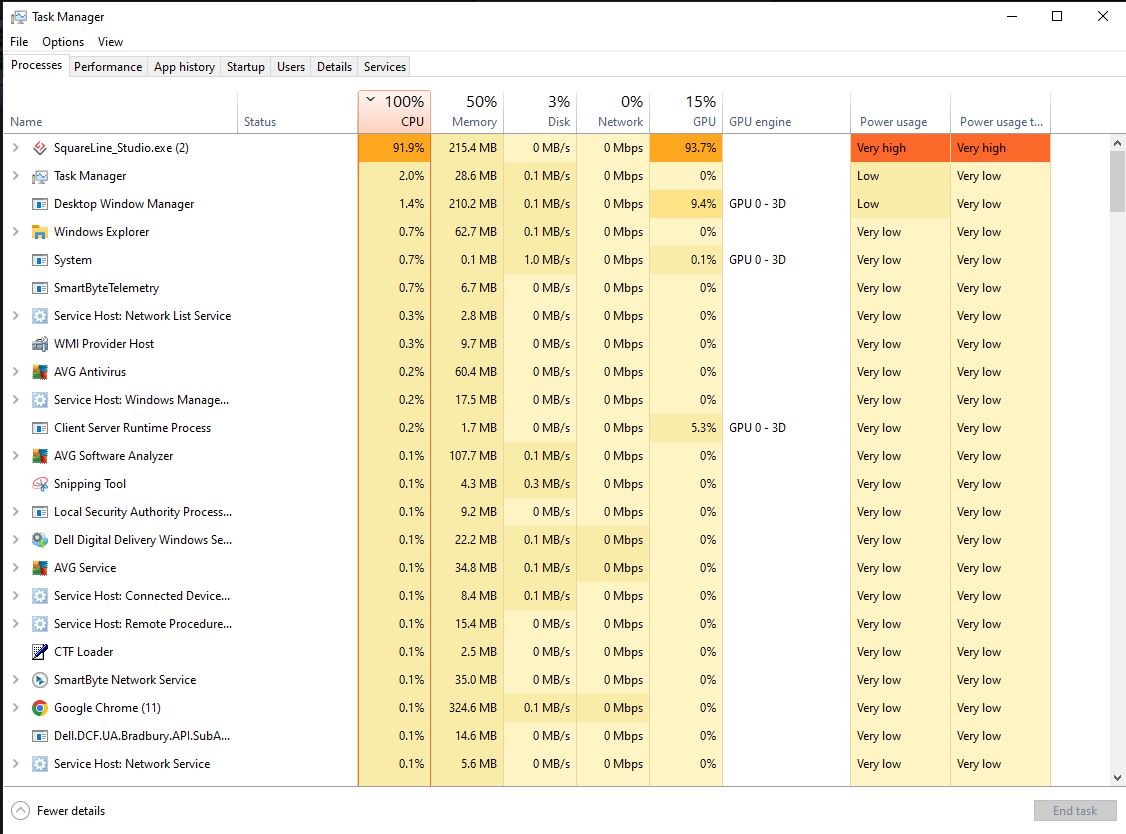
Reading the forum I spotted a thread for hi GPU usage and a bat file was provide to start SLS, I tried this but no difference. (it added the command line switch " -force-opengl")

Screenshot or video

Others

  • SquareLine Studio version:
    1.1.1

  • Operating system:
    Win 10
    Running on Dell Laptop
    Intel i7-8565U CPU
    16GB RAM
    500GB SSD

  • Target hardware:
    N/A

We don’t experience this issue. Can you the logs from C:\Users<your username>\AppData\LocalLow\Game-Ever Bt_\SquareLine_Studio\Player.log
and a screenshot about Processes tab.

Hi

Please attached find logs as requested.

I wonder if this might be something to do with my AVG antivirus.
I have vague memories of it making things really slow if temporary files are created in places it keeps checking.
It might be that I need to add any squareline work directories to an AVG exception list?

================================
Log File

Mono path[0] = ‘C:/Program Files/SquareLine Studio 1.1.1/SquareLine_Studio_Data/Managed’
Mono config path = ‘C:/Program Files/SquareLine Studio 1.1.1/MonoBleedingEdge/etc’
Initialize engine version: 2021.3.9f1 (ad3870b89536)
[Subsystems] Discovering subsystems at path C:/Program Files/SquareLine Studio 1.1.1/SquareLine_Studio_Data/UnitySubsystems
GfxDevice: creating device client; threaded=1; jobified=0
d3d12: loaded!
d3d12: failed to create D3D12 device (0x887a0004).
GfxDevice: creating device client; threaded=1; jobified=0
Direct3D:
Version: Direct3D 11.0 [level 11.1]
Renderer: Microsoft Basic Render Driver (ID=0x8c)
Vendor: Microsoft
VRAM: 8095 MB
Begin MonoManager ReloadAssembly

  • Completed reload, in 0.082 seconds
    Dedicated video D3D11 device creation failed (error: 0x887a0004). This device is used specifically for video decoding, we will use software video decoding instead.
    Initializing input.

XInput1_3.dll not found. Trying XInput9_1_0.dll instead…
Input initialized.

Initialized touch support.

UnloadTime: 15.126300 ms
CurrentCulture converted to en-US
go back to front
Setting up 2 worker threads for Enlighten.
Connection closed
StopServer
Memory Statistics:
[ALLOC_TEMP_TLS] TLS Allocator
StackAllocators :
[ALLOC_TEMP_MAIN]
Peak usage frame count: [0-1.0 KB]: 1400 frames, [8.0 KB-16.0 KB]: 1 frames, [16.0 KB-32.0 KB]: 1 frames, [32.0 KB-64.0 KB]: 2 frames, [2.0 MB-4.0 MB]: 1 frames
Initial Block Size 4.0 MB
Current Block Size 4.0 MB
Peak Allocated Bytes 2.0 MB
Overflow Count 0
[ALLOC_TEMP_Loading.AsyncRead]
Initial Block Size 64.0 KB
Current Block Size 64.0 KB
Peak Allocated Bytes 285 B
Overflow Count 0
[ALLOC_TEMP_Loading.PreloadManager]
Initial Block Size 256.0 KB
Current Block Size 0.5 MB
Peak Allocated Bytes 318.5 KB
Overflow Count 10
[ALLOC_TEMP_Background Job.Worker 8]
Initial Block Size 32.0 KB
Current Block Size 32.0 KB
Peak Allocated Bytes 54 B
Overflow Count 0
[ALLOC_TEMP_Job.Worker 6]
Initial Block Size 256.0 KB
Current Block Size 256.0 KB
Peak Allocated Bytes 40.1 KB
Overflow Count 0
[ALLOC_TEMP_Job.Worker 0]
Initial Block Size 256.0 KB
Current Block Size 256.0 KB
Peak Allocated Bytes 16 B
Overflow Count 0
[ALLOC_TEMP_Background Job.Worker 10]
Initial Block Size 32.0 KB
Current Block Size 32.0 KB
Peak Allocated Bytes 54 B
Overflow Count 0
[ALLOC_TEMP_Background Job.Worker 9]
Initial Block Size 32.0 KB
Current Block Size 32.0 KB
Peak Allocated Bytes 54 B
Overflow Count 0
[ALLOC_TEMP_Job.Worker 5]
Initial Block Size 256.0 KB
Current Block Size 256.0 KB
Peak Allocated Bytes 16 B
Overflow Count 0
[ALLOC_TEMP_Background Job.Worker 14]
Initial Block Size 32.0 KB
Current Block Size 32.0 KB
Peak Allocated Bytes 54 B
Overflow Count 0
[ALLOC_TEMP_Background Job.Worker 6]
Initial Block Size 32.0 KB
Current Block Size 32.0 KB
Peak Allocated Bytes 54 B
Overflow Count 0
[ALLOC_TEMP_Job.Worker 4]
Initial Block Size 256.0 KB
Current Block Size 256.0 KB
Peak Allocated Bytes 16 B
Overflow Count 0
[ALLOC_TEMP_Job.Worker 3]
Initial Block Size 256.0 KB
Current Block Size 256.0 KB
Peak Allocated Bytes 16 B
Overflow Count 0
[ALLOC_TEMP_Background Job.Worker 12]
Initial Block Size 32.0 KB
Current Block Size 32.0 KB
Peak Allocated Bytes 54 B
Overflow Count 0
[ALLOC_TEMP_EnlightenWorker] x 2
Initial Block Size 64.0 KB
Current Block Size 64.0 KB
Peak Allocated Bytes 54 B
Overflow Count 0
[ALLOC_TEMP_Background Job.Worker 15]
Initial Block Size 32.0 KB
Current Block Size 32.0 KB
Peak Allocated Bytes 54 B
Overflow Count 0
[ALLOC_TEMP_Background Job.Worker 1]
Initial Block Size 32.0 KB
Current Block Size 32.0 KB
Peak Allocated Bytes 65 B
Overflow Count 0
[ALLOC_TEMP_Background Job.Worker 2]
Initial Block Size 32.0 KB
Current Block Size 32.0 KB
Peak Allocated Bytes 54 B
Overflow Count 0
[ALLOC_TEMP_Background Job.Worker 7]
Initial Block Size 32.0 KB
Current Block Size 32.0 KB
Peak Allocated Bytes 54 B
Overflow Count 0
[ALLOC_TEMP_UnityGfxDeviceWorker]
Initial Block Size 256.0 KB
Current Block Size 256.0 KB
Peak Allocated Bytes 2.5 KB
Overflow Count 0
[ALLOC_TEMP_AssetGarbageCollectorHelper] x 7
Initial Block Size 64.0 KB
Current Block Size 64.0 KB
Peak Allocated Bytes 0 B
Overflow Count 0
[ALLOC_TEMP_Background Job.Worker 5]
Initial Block Size 32.0 KB
Current Block Size 32.0 KB
Peak Allocated Bytes 54 B
Overflow Count 0
[ALLOC_TEMP_Background Job.Worker 13]
Initial Block Size 32.0 KB
Current Block Size 32.0 KB
Peak Allocated Bytes 54 B
Overflow Count 0
[ALLOC_TEMP_Job.Worker 1]
Initial Block Size 256.0 KB
Current Block Size 256.0 KB
Peak Allocated Bytes 40.0 KB
Overflow Count 0
[ALLOC_TEMP_Job.Worker 2]
Initial Block Size 256.0 KB
Current Block Size 256.0 KB
Peak Allocated Bytes 40.0 KB
Overflow Count 0
[ALLOC_TEMP_Background Job.Worker 3]
Initial Block Size 32.0 KB
Current Block Size 32.0 KB
Peak Allocated Bytes 54 B
Overflow Count 0
[ALLOC_TEMP_Background Job.Worker 11]
Initial Block Size 32.0 KB
Current Block Size 32.0 KB
Peak Allocated Bytes 54 B
Overflow Count 0
[ALLOC_TEMP_Background Job.Worker 0]
Initial Block Size 32.0 KB
Current Block Size 32.0 KB
Peak Allocated Bytes 2.6 KB
Overflow Count 0
[ALLOC_TEMP_Background Job.Worker 4]
Initial Block Size 32.0 KB
Current Block Size 32.0 KB
Peak Allocated Bytes 54 B
Overflow Count 0
[ALLOC_TEMP_BatchDeleteObjects]
Initial Block Size 64.0 KB
Current Block Size 64.0 KB
Peak Allocated Bytes 54 B
Overflow Count 0
[ALLOC_DEFAULT] Dual Thread Allocator
Peak main deferred allocation count 242
[ALLOC_BUCKET]
Large Block size 4.0 MB
Used Block count 1
Peak Allocated bytes 1.3 MB
[ALLOC_DEFAULT_MAIN]
Peak usage frame count: [8.0 MB-16.0 MB]: 1404 frames, [16.0 MB-32.0 MB]: 1 frames
Requested Block Size 16.0 MB
Peak Block count 1
Peak Allocated memory 28.2 MB
Peak Large allocation bytes 16.0 MB
[ALLOC_DEFAULT_THREAD]
Peak usage frame count: [2.0 MB-4.0 MB]: 1404 frames, [16.0 MB-32.0 MB]: 1 frames
Requested Block Size 16.0 MB
Peak Block count 1
Peak Allocated memory 23.8 MB
Peak Large allocation bytes 23.7 MB
[ALLOC_TEMP_JOB_1_FRAME]
Initial Block Size 2.0 MB
Used Block Count 1
Overflow Count (too large) 0
Overflow Count (full) 0
[ALLOC_TEMP_JOB_2_FRAMES]
Initial Block Size 2.0 MB
Used Block Count 1
Overflow Count (too large) 0
Overflow Count (full) 0
[ALLOC_TEMP_JOB_4_FRAMES (JobTemp)]
Initial Block Size 2.0 MB
Used Block Count 2
Overflow Count (too large) 0
Overflow Count (full) 0
[ALLOC_TEMP_JOB_ASYNC (Background)]
Initial Block Size 1.0 MB
Used Block Count 3
Overflow Count (too large) 0
Overflow Count (full) 0
[ALLOC_GFX] Dual Thread Allocator
Peak main deferred allocation count 4
[ALLOC_BUCKET]
Large Block size 4.0 MB
Used Block count 1
Peak Allocated bytes 1.3 MB
[ALLOC_GFX_MAIN]
Peak usage frame count: [4.0 MB-8.0 MB]: 1405 frames
Requested Block Size 16.0 MB
Peak Block count 1
Peak Allocated memory 7.6 MB
Peak Large allocation bytes 0 B
[ALLOC_GFX_THREAD]
Peak usage frame count: [256.0 KB-0.5 MB]: 1405 frames
Requested Block Size 16.0 MB
Peak Block count 1
Peak Allocated memory 292.4 KB
Peak Large allocation bytes 0 B
[ALLOC_CACHEOBJECTS] Dual Thread Allocator
Peak main deferred allocation count 3
[ALLOC_BUCKET]
Large Block size 4.0 MB
Used Block count 1
Peak Allocated bytes 1.3 MB
[ALLOC_CACHEOBJECTS_MAIN]
Peak usage frame count: [1.0 MB-2.0 MB]: 1405 frames
Requested Block Size 4.0 MB
Peak Block count 1
Peak Allocated memory 1.2 MB
Peak Large allocation bytes 0 B
[ALLOC_CACHEOBJECTS_THREAD]
Peak usage frame count: [2.0 MB-4.0 MB]: 1404 frames, [4.0 MB-8.0 MB]: 1 frames
Requested Block Size 4.0 MB
Peak Block count 2
Peak Allocated memory 6.9 MB
Peak Large allocation bytes 0 B
[ALLOC_TYPETREE] Dual Thread Allocator
Peak main deferred allocation count 0
[ALLOC_BUCKET]
Large Block size 4.0 MB
Used Block count 1
Peak Allocated bytes 1.3 MB
[ALLOC_TYPETREE_MAIN]
Peak usage frame count: [0-1.0 KB]: 1405 frames
Requested Block Size 2.0 MB
Peak Block count 1
Peak Allocated memory 1.0 KB
Peak Large allocation bytes 0 B
[ALLOC_TYPETREE_THREAD]
Peak usage frame count: [8.0 KB-16.0 KB]: 1404 frames, [16.0 KB-32.0 KB]: 1 frames
Requested Block Size 2.0 MB
Peak Block count 1
Peak Allocated memory 16.3 KB
Peak Large allocation bytes 0 B

I’m having exactly the same problem on Linux ( Fedora 36 - kernel 5.19.15-201 ), version 1.1.1 of SLS. No error apparently occur, but all cores go to 100% by just starting the application.

I’ve found my problem. My video drivers were not correctly installed and was running all on CPU. After the drivers were fixed, no more problems

1 Like

Hi,

Please try starting SquareLine with the -force-opengl flag from terminal:

SquareLine_Studio.exe -force-opengl

Hi

I already tried this at step 1.
But for completeness tried again, no improvement.
Here is the process tab, no project open, loaded using the -force-opengl switch.

More Info.

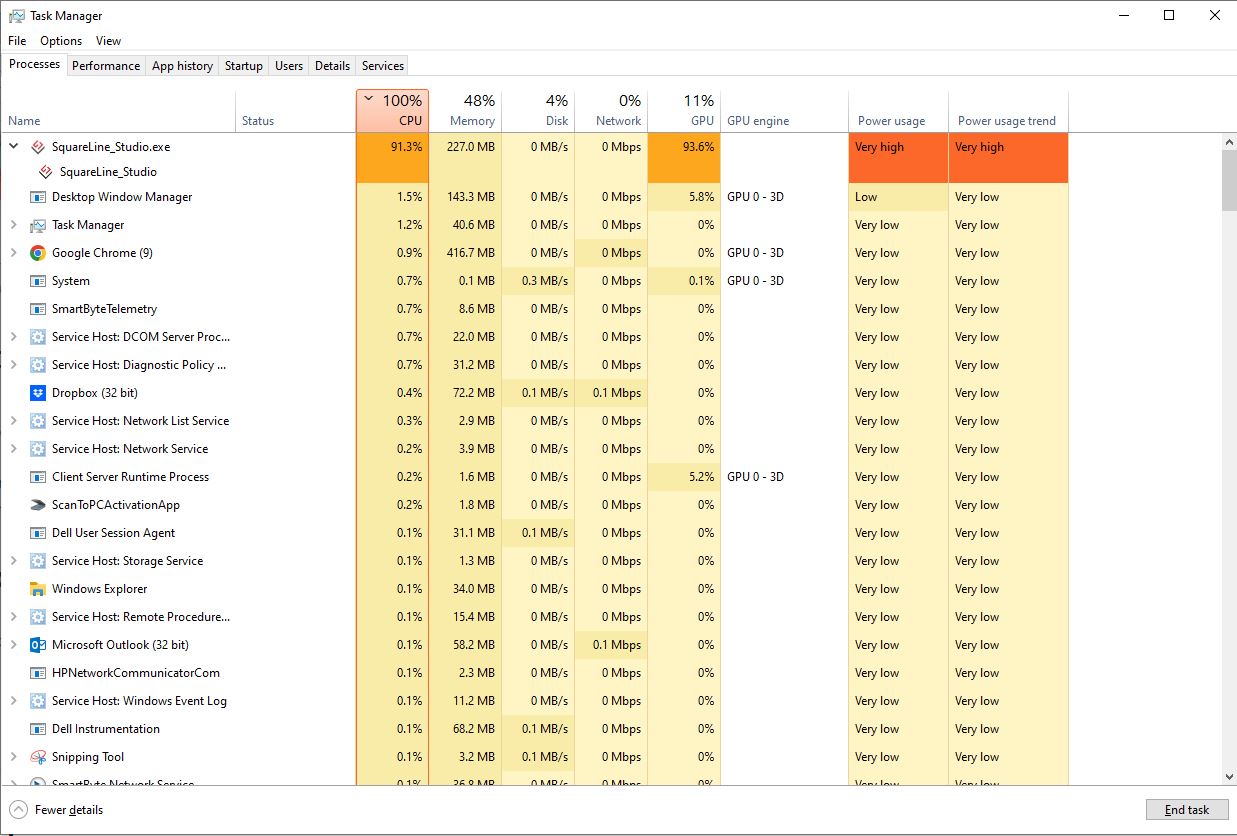
Strange, I loaded a project that I had previously created from scratch.
The CPU load was still running at 100%.
Did a few things, then exported the UI and heard the fans on laptop slow down.
Checked the CPU load and it is now running at a very reasonable 3.5%.

Saved and closed everything.
Re-started SLS and CPU back at 100%.
I can’t replicated the CPU load reduction again.

Okay, so it’s not a permanent issue meaning it’s not a Unity (SLS created with Unity) build setting, or hardware incompatibility problem.

What if you turn off AVG antivirus for a minute? I can’t imagine any folder that should be added to the exception list but it might be worth e a try.

Hi

So I started this thread using the trial version of SLS 1.1.1.
Since our last message the trial has expired and I have registered a personal copy.
Since then I am unable the replicate the very high CPU usage, so can’t try disabling AVG.

I can now run 3 instances of SLS one with the 3D Printer demo, 1 with the Smart Gadget demo, and 1 with a project I have started, and no excess CPU load?

I guess you may as well park this unless the trial thing is a clue that helps.
If I find I can replicated it again I’ll let you know.

Good to hear it’s working well now even with three instances.

Thank you!