What do you want to achieve?
- if the chart widget is the best method for the sensor waveform displaying.
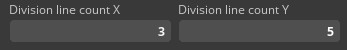
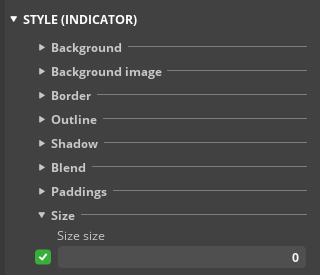
- How to adjust the row spacing and column spacing of grid line for chart widget?
- How to make the nodes of chart data line invisible.
What have you tried so far?
Screenshot or video
Others
- SquareLine Studio version:
- Operating system:
- Target hardware: